

Deep learning has revolutionized the field of artificial intelligence by enabling machines to learn from large amounts of data without being explicitly programmed. However, understanding how these models make decisions can be challenging, especially when they are used for critical applications such as medical diagnosis or autonomous driving. To address this challenge, researchers have developed a range of techniques and tools for interpreting deep learning models. In this blog post, we will explore some of these techniques and tools, including activation maps, saliency maps, and feature visualization.
Activation Maps
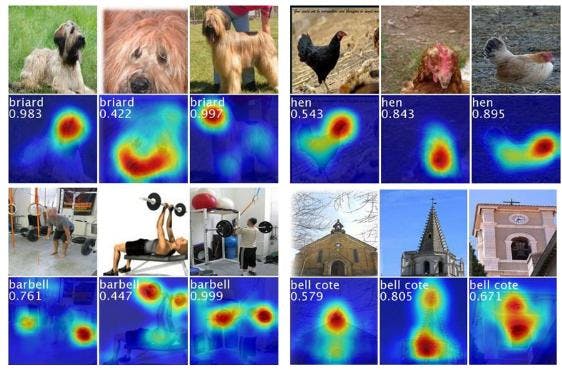
Activation maps are a way to visualize the output of individual neurons in a deep learning model. They can be useful for understanding which parts of an input image or sequence are most important for a particular neuron. To generate an activation map, we first select a specific neuron in the model and then backpropagate the gradient of its output with respect to the input. This produces a heatmap that highlights the regions of the input that most strongly activate the neuron.
Suppose we have a neural network with a single hidden layer containing 10 neurons. Each neuron in the hidden layer receives input from the image and produces an output. Activation maps can be used to visualize the output of each neuron, showing which parts of the image contributed to that neuron's activation. For example, we might find that one neuron activates when there's a cat's nose in the image, while another neuron activates when there's a dog's ear.
Saliency Maps
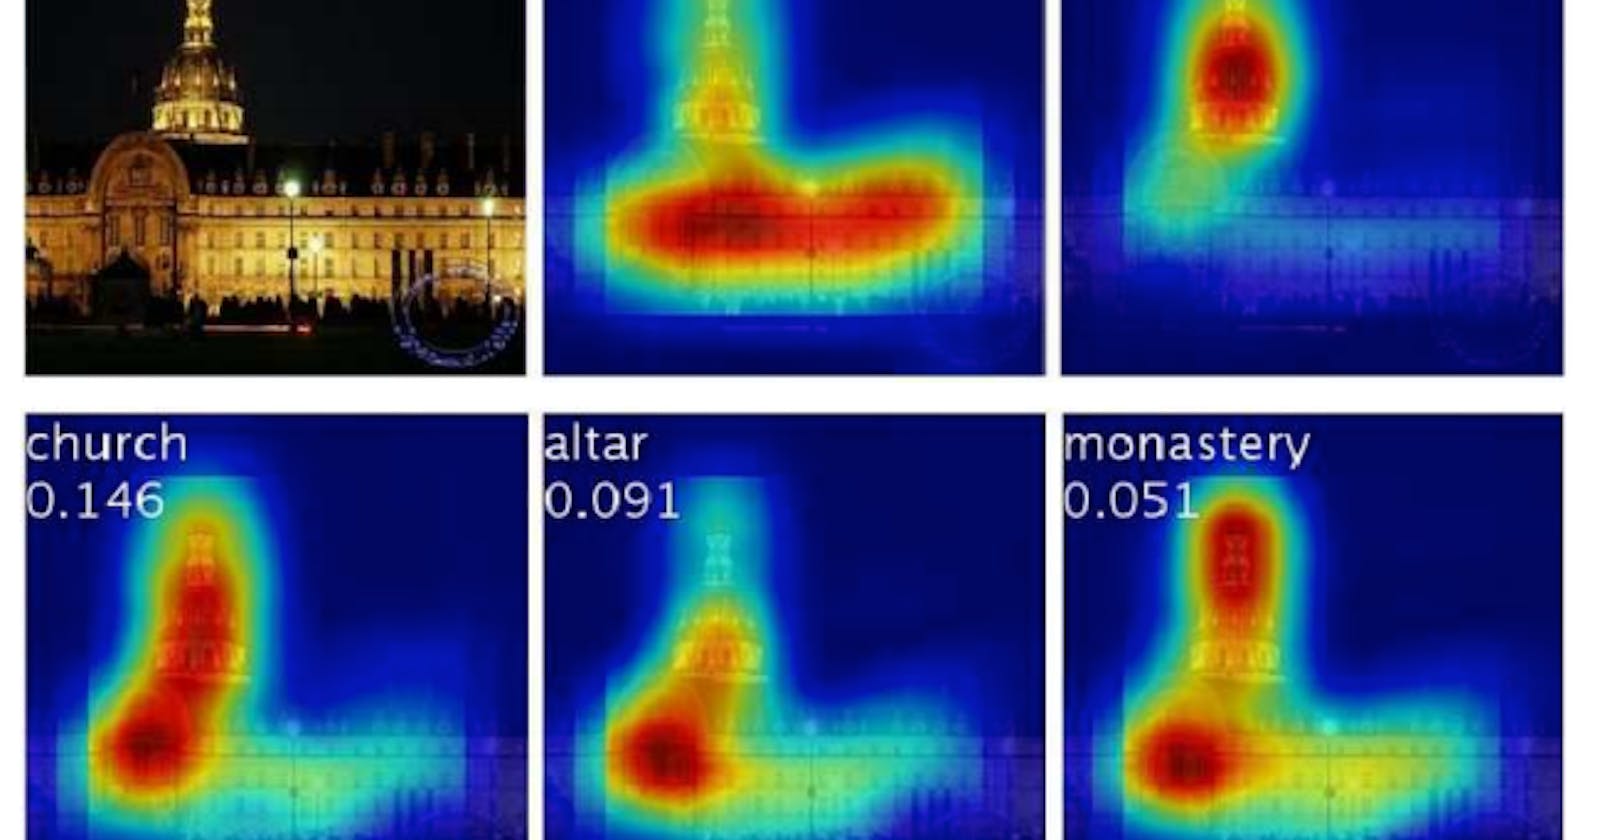
Saliency maps are similar to activation maps, but they highlight the regions of the input that are most important for the overall prediction of the model, rather than the output of a specific neuron. To generate a saliency map, we compute the gradient of the model's output with respect to the input. This produces a heatmap that shows which regions of the input have the greatest impact on the model's prediction.
Saliency maps can be used to determine which regions of an image were most important for the neural network's final decision of whether the image contains a cat or a dog. We can generate a saliency map for an image to highlight which pixels of the image contributed most to the neural network's decision. For example, we might find that the neural network focuses most on the shape of the animal's head to make its decision.
Feature Visualization
Feature visualization is a technique for generating synthetic inputs that maximize the activation of specific neurons in a deep learning model. This can be useful for understanding what types of features the model is looking for when it makes predictions.
To generate a synthetic input, we start with a random noise image and then iteratively adjust it to maximize the activation of a particular neuron. This produces an image that is optimized to activate the chosen neuron. By visualizing these synthetic inputs, we can gain insights into the types of features that the model is using to make its predictions.
Feature visualization can be used to generate images that activate specific neurons in the neural network. We can choose a neuron in the network and generate an image that maximally activates that neuron. This can help us understand what kinds of features the neural network is looking for to make its decision. For example, we might find that the network is looking for the presence of whiskers or fur to identify the animal as a cat or a dog.
Activation maps, saliency maps, and feature visualization are just a few of the many techniques that can be used to understand how deep learning models work. By using these techniques, we can develop more accurate and interpretable models, troubleshoot performance issues, and build more trustworthy AI systems.